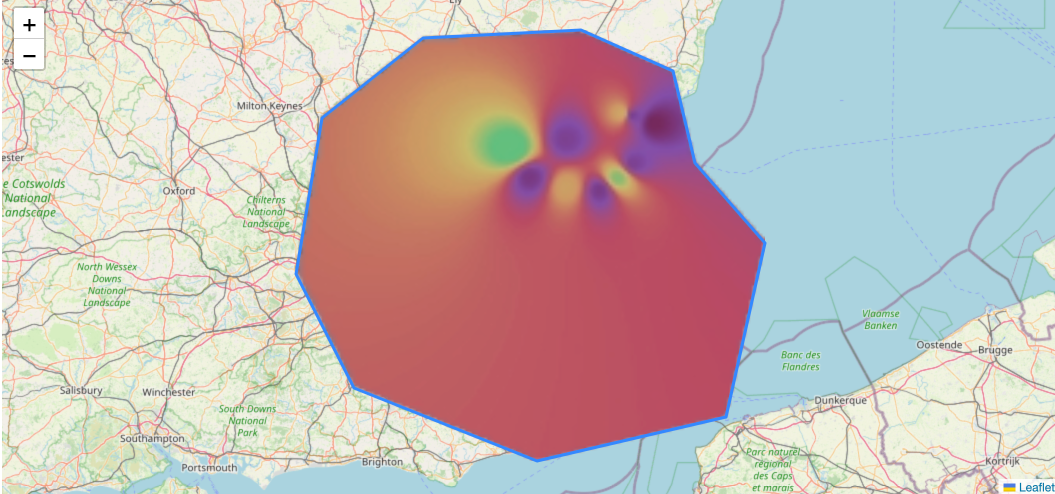
Result
- About 5 s per image (hourly cron, 4 GB RAM, 2 CPUs) to 30 ms for 20 images
- At 5 req/s: average 29 ms in Go with JPEG vs 419 ms in Node.js
- Any past time range and custom resolution, distance power and wind settings
Stack
GoNode.jsPython (old version)IDW interpolationJPEG encodingLeaflet
Built at my day job, where I lead the software team behind the Envizom platform. The code belongs to the company; this write-up comes from my public blog post.
The problem
Heatmaps were made by a Python cron every hour: IDW interpolation with wind speed and direction over a 1 km grid, stored as Base64 PNGs in a time-series database. It used 4 GB of RAM and 2 CPUs and still wasn't enough, each image took seconds, and only a fixed 1-hour average existed. With three configs it was already not keeping up.
What I built
- A weekend proof of concept that rendered the heatmap in the browser, to show it could be done on request.
- A Node.js server, then a Go service. It maps the boundary and devices onto a grid once, precomputes each device's weight on every pixel, and then fills each snapshot from those weights.
- A time log on every function showed Base64 PNG encoding taking 80% of the time. Switching to JPEG fixed it; the frontend masks the image to the boundary, since JPEG has no transparency, and a 2 px margin keeps low-resolution edges sharp.
Result
| Load for 5 s | Node.js | Go, Base64 PNG | Go, JPEG |
|---|---|---|---|
| 5 req/s | avg 419 ms | avg 114 ms | avg 29 ms |
| 50 req/s | avg 14,687 ms | avg 458 ms | avg 88 ms |
From about 5 seconds per image to 30 ms for 20 images, on request, for any past time range, with custom resolution, distance power and wind settings instead of fixed options.